前提
最近的一个项目中涉及到文件上传和下载,使用到JUC的线程池ThreadPoolExecutor,在生产环境中出现了某些时刻线程池满负载运作,由于使用了CallerRunsPolicy拒绝策略,导致满负载情况下,应用接口调用无法响应,处于假死状态。考虑到之前用micrometer + prometheus + grafana搭建过监控体系,于是考虑使用micrometer做一次主动的线程池度量数据采集,最终可以相对实时地展示在grafana的面板中。
实践过程
下面通过真正的实战过程做一个仿真的例子用于复盘。
代码改造
首先我们要整理一下ThreadPoolExecutor中提供的度量数据项和micrometer对应的Tag的映射关系:
- 线程池名称,Tag:
thread.pool.name,这个很重要,用于区分各个线程池的数据,如果使用IOC容器管理,可以使用BeanName代替。
int getCorePoolSize():核心线程数,Tag:thread.pool.core.size。int getLargestPoolSize():历史峰值线程数,Tag:thread.pool.largest.size。int getMaximumPoolSize():最大线程数(线程池线程容量),Tag:thread.pool.max.size。int getActiveCount():当前活跃线程数,Tag:thread.pool.active.size。int getPoolSize():当前线程池中运行的线程总数(包括核心线程和非核心线程),Tag:thread.pool.thread.count。- 当前任务队列中积压任务的总数,Tag:
thread.pool.queue.size,这个需要动态计算得出。
接着编写具体的代码,实现的功能如下:
- 1、建立一个
ThreadPoolExecutor实例,核心线程和最大线程数为10,任务队列长度为10,拒绝策略为AbortPolicy。
- 2、提供两个方法,分别使用线程池实例模拟短时间耗时的任务和长时间耗时的任务。
- 3、提供一个方法用于清空线程池实例中的任务队列。
- 4、提供一个单线程的调度线程池用于定时收集
ThreadPoolExecutor实例中上面列出的度量项,保存到micrometer内存态的收集器中。
由于这些统计的值都会跟随时间发生波动性变更,可以考虑选用Gauge类型的Meter进行记录。
import io.micrometer.core.instrument.Metrics;
import io.micrometer.core.instrument.Tag;
import org.springframework.beans.factory.InitializingBean;
import org.springframework.stereotype.Service;
import java.util.Collections;
import java.util.concurrent.*;
import java.util.concurrent.atomic.AtomicInteger;
@Service
public class ThreadPoolMonitor implements InitializingBean {
private static final String EXECUTOR_NAME = "ThreadPoolMonitorSample";
private static final Iterable<Tag> TAG = Collections.singletonList(Tag.of("thread.pool.name", EXECUTOR_NAME));
private final ScheduledExecutorService scheduledExecutor = Executors.newSingleThreadScheduledExecutor();
private final ThreadPoolExecutor executor = new ThreadPoolExecutor(10, 10, 0, TimeUnit.SECONDS,
new ArrayBlockingQueue<>(10), new ThreadFactory() {
private final AtomicInteger counter = new AtomicInteger();
@Override
public Thread newThread(Runnable r) {
Thread thread = new Thread(r);
thread.setDaemon(true);
thread.setName("thread-pool-" + counter.getAndIncrement());
return thread;
}
}, new ThreadPoolExecutor.AbortPolicy());
private Runnable monitor = () -> {
try {
Metrics.gauge("thread.pool.core.size", TAG, executor, ThreadPoolExecutor::getCorePoolSize);
Metrics.gauge("thread.pool.largest.size", TAG, executor, ThreadPoolExecutor::getLargestPoolSize);
Metrics.gauge("thread.pool.max.size", TAG, executor, ThreadPoolExecutor::getMaximumPoolSize);
Metrics.gauge("thread.pool.active.size", TAG, executor, ThreadPoolExecutor::getActiveCount);
Metrics.gauge("thread.pool.thread.count", TAG, executor, ThreadPoolExecutor::getPoolSize);
Metrics.gauge("thread.pool.queue.size", TAG, executor, e -> e.getQueue().size());
} catch (Exception e) {
}
};
@Override
public void afterPropertiesSet() throws Exception {
scheduledExecutor.scheduleWithFixedDelay(monitor, 0, 5, TimeUnit.SECONDS);
}
public void shortTimeWork() {
executor.execute(() -> {
try {
Thread.sleep(5000);
} catch (InterruptedException e) {
}
});
}
public void longTimeWork() {
executor.execute(() -> {
try {
Thread.sleep(5000 * 100);
} catch (InterruptedException e) {
}
});
}
public void clearTaskQueue() {
executor.getQueue().clear();
}
}
import club.throwable.smp.service.ThreadPoolMonitor;
import lombok.RequiredArgsConstructor;
import org.springframework.http.ResponseEntity;
import org.springframework.web.bind.annotation.GetMapping;
import org.springframework.web.bind.annotation.RestController;
@RequiredArgsConstructor
@RestController
public class ThreadPoolMonitorController {
private final ThreadPoolMonitor threadPoolMonitor;
@GetMapping(value = "/shortTimeWork")
public ResponseEntity<String> shortTimeWork() {
threadPoolMonitor.shortTimeWork();
return ResponseEntity.ok("success");
}
@GetMapping(value = "/longTimeWork")
public ResponseEntity<String> longTimeWork() {
threadPoolMonitor.longTimeWork();
return ResponseEntity.ok("success");
}
@GetMapping(value = "/clearTaskQueue")
public ResponseEntity<String> clearTaskQueue() {
threadPoolMonitor.clearTaskQueue();
return ResponseEntity.ok("success");
}
}
|
配置如下:
server:
  port: 9091
management:
  server:
    port: 9091
  endpoints:
    web:
      exposure:
        include: '*'
      base-path: /management
|
prometheus的调度Job也可以适当调高频率,这里默认是15秒拉取一次/prometheus端点,也就是会每次提交3个收集周期的数据。项目启动之后,可以尝试调用/management/prometheus查看端点提交的数据:
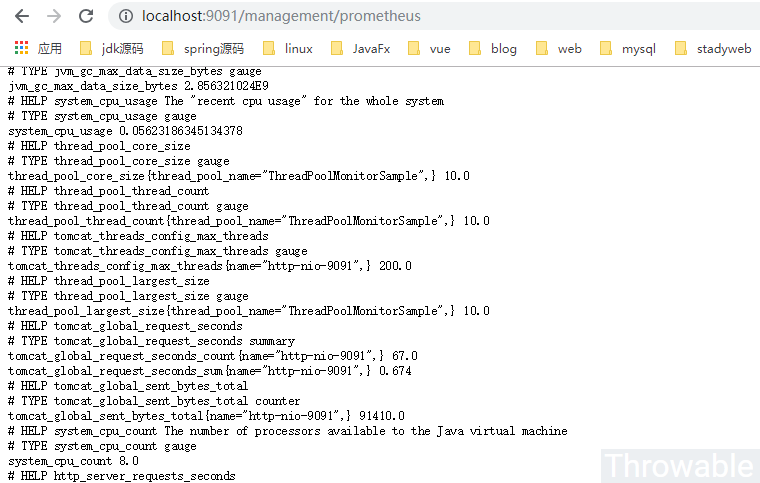
因为ThreadPoolMonitorSample是我们自定义命名的Tag,看到相关字样说明数据收集是正常的。如果prometheus的Job没有配置错误,在本地的spring-boot项目起来后,可以查下prometheus的后台:

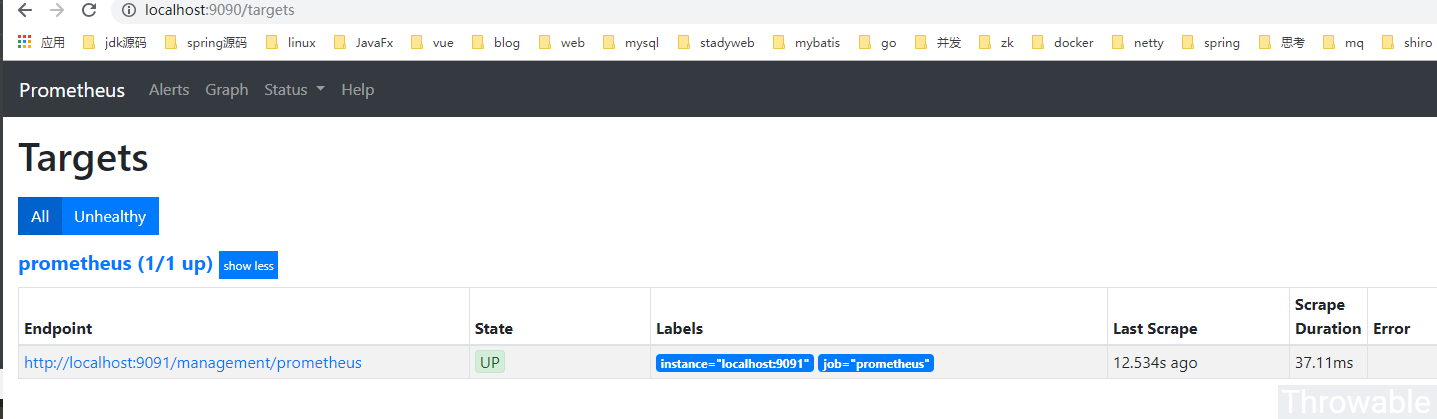
OK,完美,可以进行下一步。
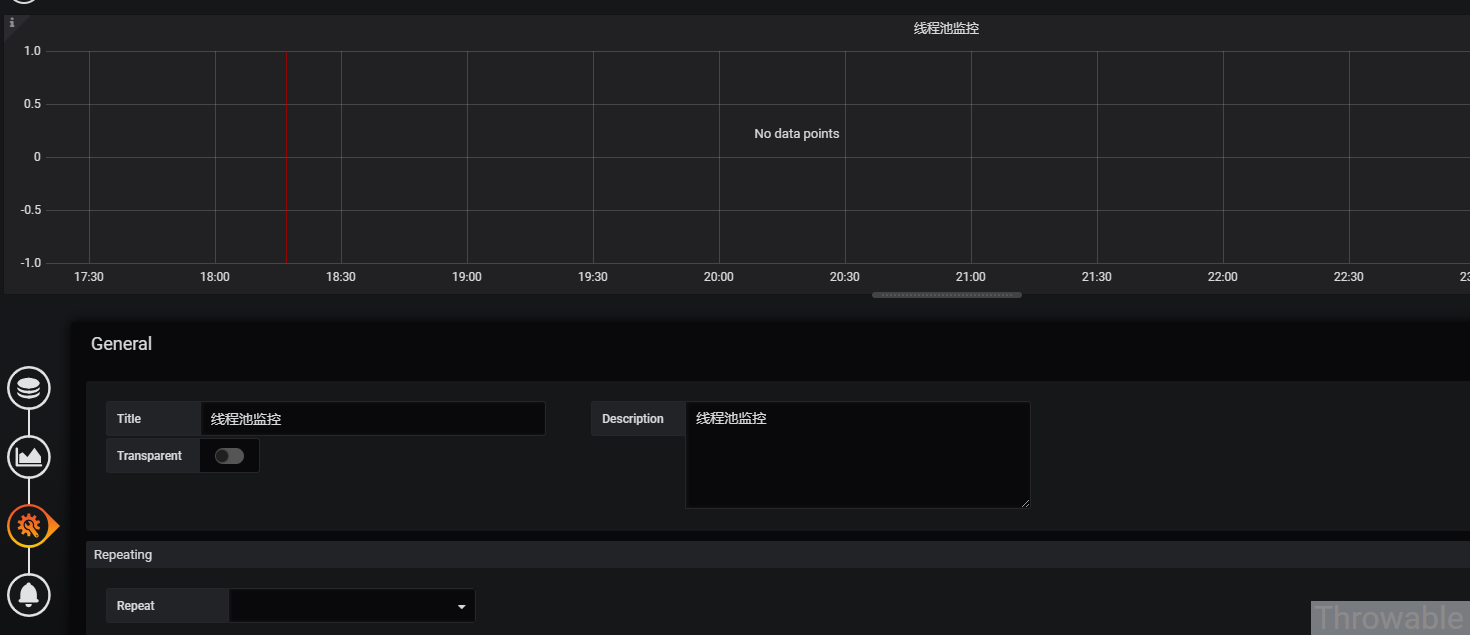
grafana面板配置
确保JVM应用和prometheus的调度Job是正常的情况下,接下来重要的一步就是配置grafana面板。如果暂时不想认真学习一下prometheus的PSQL的话,可以从prometheus后台的/graph面板直接搜索对应的样本表达式拷贝进去grafana配置中就行,当然最好还是去看下prometheus的文档系统学习一下怎么编写PSQL。
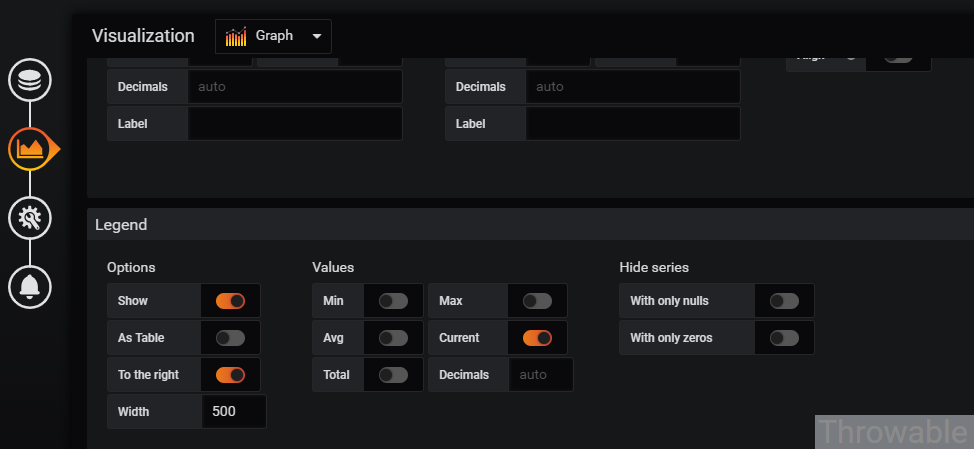
- 查询配置,这个是最重要的,最终图表就是靠查询配置展示的:
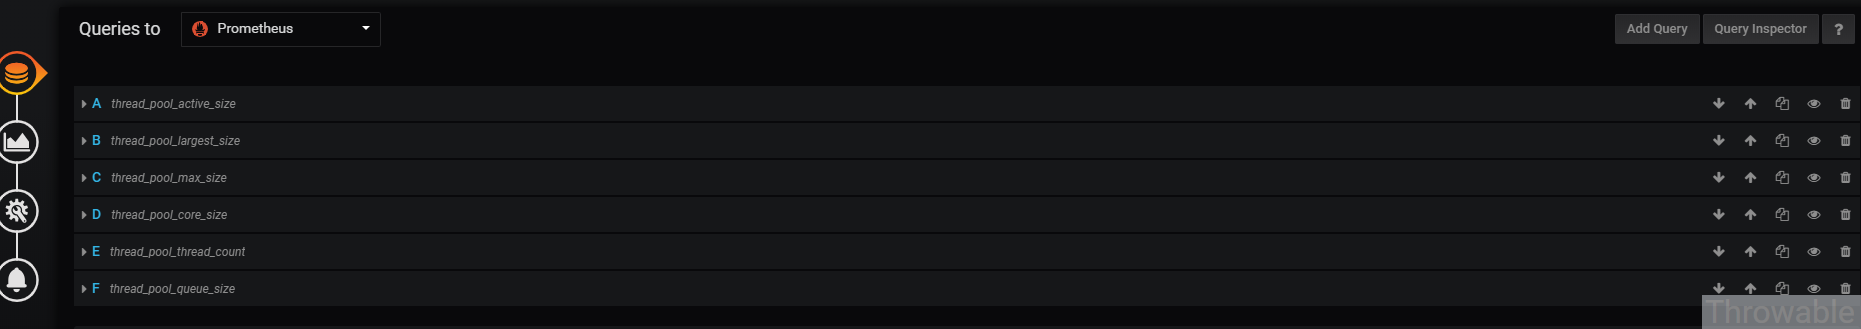
查询配置具体如下:
- A:thread_pool_active_size,Legend:{{instance}}-{{thread_pool_name}}线程池活跃线程数。
- B:thread_pool_largest_size,Legend:{{instance}}-{{thread_pool_name}}线程池历史峰值线程数。
- C:thread_pool_max_size,Legend:{{instance}}-{{thread_pool_name}}线程池容量。
- D:thread_pool_core_size,Legend:{{instance}}-{{thread_pool_name}}线程池核心线程数。
- E:thread_pool_thread_count,Legend:{{instance}}-{{thread_pool_name}}线程池运行中的线程数。
- F:thread_pool_queue_size,Legend:{{instance}}-{{thread_pool_name}}线程池积压任务数。
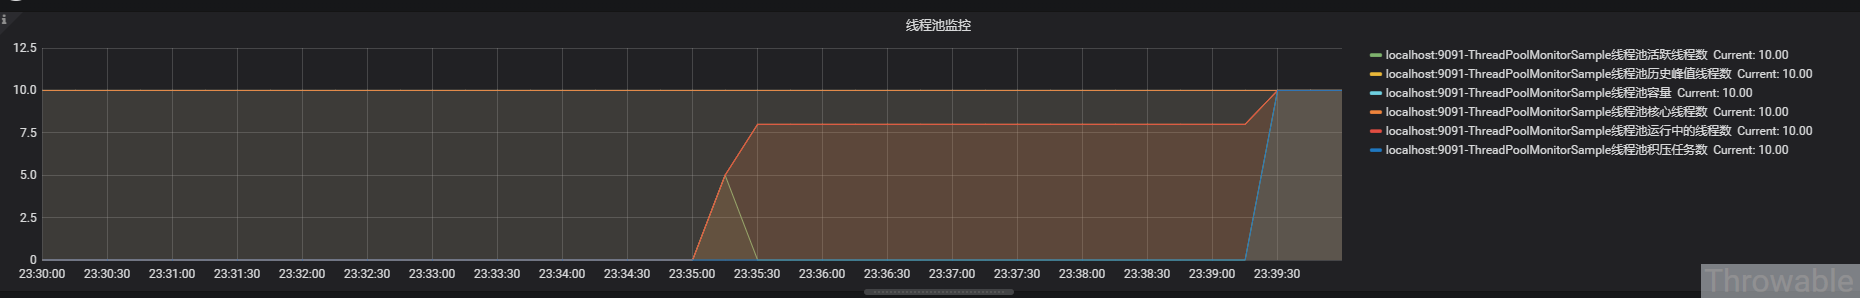
最终效果
多调用几次例子中提供的几个接口,就能得到一个监控线程池呈现的图表:
小结
针对线程池ThreadPoolExecutor的各项数据进行监控,有利于及时发现使用线程池的接口的异常,如果想要快速恢复,最有效的途径是:清空线程池中任务队列中积压的任务。具体的做法是:可以把ThreadPoolExecutor委托到IOC容器管理,并且把ThreadPoolExecutor的任务队列清空的方法暴露成一个REST端点即可。像HTTP客户端的连接池如Apache-Http-Client或者OkHttp等的监控,可以用类似的方式实现,数据收集的时候可能由于加锁等原因会有少量的性能损耗,不过这些都是可以忽略的,如果真的怕有性能影响,可以尝试用反射API直接获取ThreadPoolExecutor实例内部的属性值,这样就可以避免加锁的性能损耗。
(本文完 c-2-d 20190414)